Introduction


ToTheMoon is a multifunctional robot, configured according to your trading profile, being able to operate using a Grid and using the average price, or in the conventional way and opening just Single Order in each direction. It has the following indicators as an option for the opening signal or counter signal: Bollinger Bands, Envelopes, Keltner Channels, MACD, RSI, Parabolic, Stochastic, Force Index, Ichimoku, Fractals, Osma, ADX, ATR, STOP ATR, CCI, Moving Averages , VWAP, Hilo, Pivot Point, Support and Resistance, Manual Lines, Candle Sequence, Price GAP, Candle Price Distance, Filter Bollinger Bands, Filter Envelopes, Filter ADX, Filter ATR, Filter Volume, Filter Candle Size, Filter Price GAP and Filter Candle Price Distance, being It is possible to use up to 5 of them at the same time, to define the buy or sell opening. The TakeProfit, StopLoss, BreakEven and Pending Order values are worked virtually by the robot itself, in the Metatrader terminal, remaining invisible to the broker.
Grid Mode
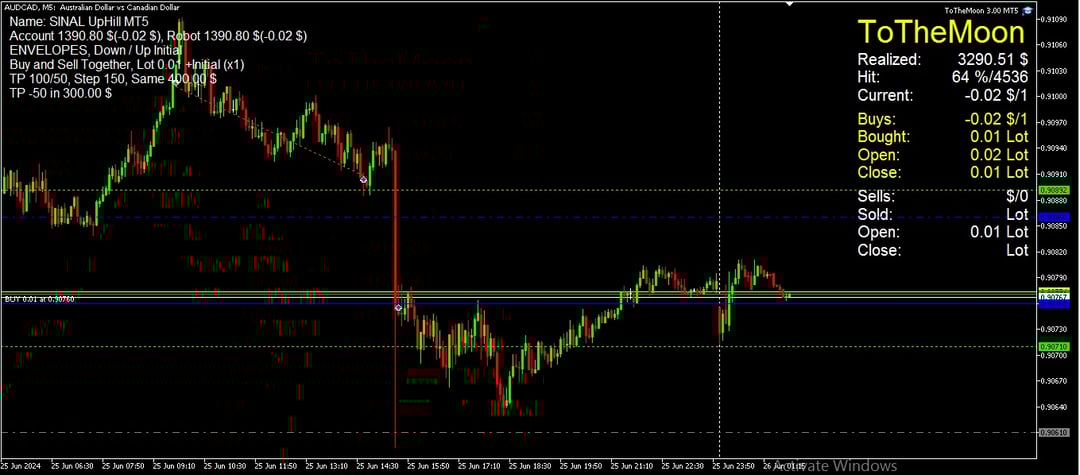
The next figure is the screen with ToTheMoon information in Grid mode. The panel on the right shows the profit realized and the hit percentage, obtained by orders already closed, it also shows the current position with open buy and sell lots and the next lots to be opened or closed, obtained by open orders. The information on the left side is some settings chosen in the PRESET and other important information that occurs during the execution of the strategy, such as blocks and balances. The chart shows the buy (blue) and sell (red) lines, with the solid line being the average price of open orders and the dashed line being the TakeProfit of the strategy.
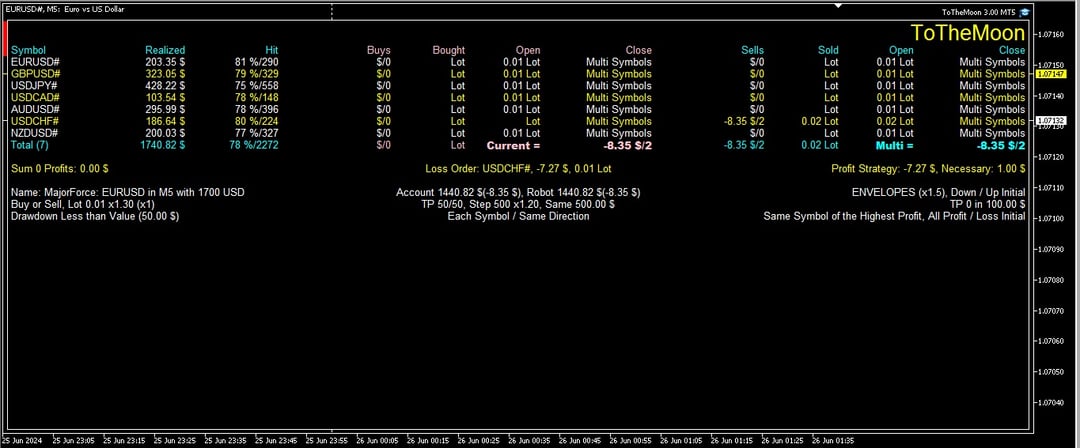
Multi Symbols
The next figure is the screen operating Multi Symbols. The panel shows data on the Symbols in a list, and strategy information, indicating whether orders will be closed using the Multi Symbols mode or separately, using the strategy chosen in the PRESET.